Abstract interpretation in the Toy Optimizer
This is a cross-post from Max Bernstein from his excellent blog where he writes about programming languages, compilers, optimizations, virtual machines. He's looking for a (dynamic language runtime or compiler related) job too.
CF Bolz-Tereick wrote some excellent posts in which they introduce a small IR and optimizer and extend it with allocation removal. We also did a live stream together in which we did some more heap optimizations.
In this blog post, I'm going to write a small abstract interpreter for the Toy IR and then show how we can use it to do some simple optimizations. It assumes that you are familiar with the little IR, which I have reproduced unchanged in a GitHub Gist.
Abstract interpretation is a general framework for efficiently computing properties that must be true for all possible executions of a program. It's a widely used approach both in compiler optimizations as well as offline static analysis for finding bugs. I'm writing this post to pave the way for CF's next post on proving abstract interpreters correct for range analysis and known bits analysis inside PyPy.
Before we begin, I want to note a couple of things:
- The Toy IR is in SSA form, which means that every variable is defined exactly once. This means that abstract properties of each variable are easy to track.
- The Toy IR represents a linear trace without control flow, meaning we won't talk about meet/join or fixpoints. They only make sense if the IR has a notion of conditional branches or back edges (loops).
Alright, let's get started.
Welcome to abstract interpretation
Abstract interpretation means a couple different things to different people. There's rigorous mathematical formalism thanks to Patrick and Radhia Cousot, our favorite power couple, and there's also sketchy hand-wavy stuff like what will follow in this post. In the end, all people are trying to do is reason about program behavior without running it.
In particular, abstract interpretation is an over-approximation of the behavior of a program. Correctly implemented abstract interpreters never lie, but they might be a little bit pessimistic. This is because instead of using real values and running the program---which would produce a concrete result and some real-world behavior---we "run" the program with a parallel universe of abstract values. This abstract run gives us information about all possible runs of the program.1
Abstract values always represent sets of concrete values. Instead of literally storing a set (in the world of integers, for example, it could get pretty big...there are a lot of integers), we group them into a finite number of named subsets.2
Let's learn a little about abstract interpretation with an example program and example abstract domain. Here's the example program:
v0 = 1
v1 = 2
v2 = add(v0, v1)
And our abstract domain is "is the number positive" (where "positive" means nonnegative, but I wanted to keep the words distinct):
       top
    /       \
positive    negative
    \       /
      bottom
The special top value means "I don't know" and the special bottom value means "empty set" or "unreachable". The positive and negative values represent the sets of all positive and negative numbers, respectively.
We initialize all the variables v0, v1, and v2 to bottom and then walk
our IR, updating our knowledge as we go.
# here
v0:bottom = 1
v1:bottom = 2
v2:bottom = add(v0, v1)
In order to do that, we have to have transfer functions for each operation. For constants, the transfer function is easy: determine if the constant is positive or negative. For other operations, we have to define a function that takes the abstract values of the operands and returns the abstract value of the result.
In order to be correct, transfer functions for operations have to be compatible with the behavior of their corresponding concrete implementations. You can think of them having an implicit universal quantifier forall in front of them.
Let's step through the constants at least:
v0:positive = 1
v1:positive = 2
# here
v2:bottom = add(v0, v1)
Now we need to figure out the transfer function for add. It's kind of tricky
right now because we haven't specified our abstract domain very well. I keep
saying "numbers", but what kinds of numbers? Integers? Real numbers? Floating
point? Some kind of fixed-width bit vector (int8, uint32, ...) like an
actual machine "integer"?
For this post, I am going to use the mathematical definition of integer, which
means that the values are not bounded in size and therefore do not overflow.
Actual hardware memory constraints aside, this is kind of like a Python int.
So let's look at what happens when we add two abstract numbers:
| top | positive | negative | bottom | |
|---|---|---|---|---|
| top | top | top | top | bottom |
| positive | top | positive | top | bottom |
| negative | top | top | negative | bottom |
| bottom | bottom | bottom | bottom | bottom |
As an example, let's try to add two numbers a and b, where a is positive
and b is negative. We don't know anything about their values other than their
signs. They could be 5 and -3, where the result is 2, or they could be
1 and -100, where the result is -99. This is why we can't say anything
about the result of this operation and have to return top.
The short of this table is that we only really know the result of an addition
if both operands are positive or both operands are negative. Thankfully, in
this example, both operands are known positive. So we can learn something about
v2:
v0:positive = 1
v1:positive = 2
v2:positive = add(v0, v1)
# here
This may not seem useful in isolation, but analyzing more complex programs even
with this simple domain may be able to remove checks such as if (v2 < 0) { ... }.
Let's take a look at another example using an sample absval (absolute value)
IR operation:
v0 = getarg(0)
v1 = getarg(1)
v2 = absval(v0)
v3 = absval(v1)
v4 = add(v2, v3)
v5 = absval(v4)
Even though we have no constant/concrete values, we can still learn something
about the states of values throughout the program. Since we know that absval
always returns a positive number, we learn that v2, v3, and v4 are all
positive. This means that we can optimize out the absval operation on v5:
v0:top = getarg(0)
v1:top = getarg(1)
v2:positive = absval(v0)
v3:positive = absval(v1)
v4:positive = add(v2, v3)
v5:positive = v4
Other interesting lattices include:
- Constants (where the middle row is pretty wide)
- Range analysis (bounds on min and max of a number)
- Known bits (using a bitvector representation of a number, which bits are always 0 or 1)
For the rest of this blog post, we are going to do a very limited version of "known bits", called parity. This analysis only tracks the least significant bit of a number, which indicates if it is even or odd.
Parity
The lattice is pretty similar to the positive/negative lattice:
    top
  /     \
even    odd
  \     /
   bottom
Let's define a data structure to represent this in Python code:
class Parity:
    def __init__(self, name):
        self.name = name

    def __repr__(self):
        return self.name
And instantiate the members of the lattice:
TOP = Parity("top")
EVEN = Parity("even")
ODD = Parity("odd")
BOTTOM = Parity("bottom")
Now let's write a forward flow analysis of a basic block using this lattice.
We'll do that by assuming that a method on Parity is defined for each IR
operation. For example, Parity.add, Parity.lshift, etc.
def analyze(block: Block) -> None:
    parity = {v: BOTTOM for v in block}

    def parity_of(value):
        if isinstance(value, Constant):
            return Parity.const(value)
        return parity[value]

    for op in block:
        transfer = getattr(Parity, op.name)
        args = [parity_of(arg.find()) for arg in op.args]
        parity[op] = transfer(*args)
For every operation, we compute the abstract value---the parity---of the
arguments and then call the corresponding method on Parity to get the
abstract result.
We need to special case Constants due to a quirk of how the Toy IR is
constructed: the constants don't appear in the instruction stream and instead
are free-floating.
Let's start by looking at the abstraction function for concrete values---constants:
class Parity:
    # ...
    @staticmethod
    def const(value):
        if value.value % 2 == 0:
            return EVEN
        else:
            return ODD
Seems reasonable enough. Let's pause on operations for a moment and consider an example program:
v0 = getarg(0)
v1 = getarg(1)
v2 = lshift(v0, 1)
v3 = lshift(v1, 1)
v4 = add(v2, v3)
v5 = dummy(v4)
This function (which is admittedly a little contrived) takes two inputs, shifts
them left by one bit, adds the result, and then checks the least significant
bit of the addition result. It then passes that result into a dummy function,
which you can think of as "return" or "escape".
To do some abstract interpretation on this program, we'll need to implement the
transfer functions for lshift and add (dummy will just always return
TOP). We'll start with add. Remember that adding two even numbers returns
an even number, adding two odd numbers returns an even number, and mixing even
and odd returns an odd number.
class Parity:
    # ...
    def add(self, other):
        if self is BOTTOM or other is BOTTOM:
            return BOTTOM
        if self is TOP or other is TOP:
            return TOP
        if self is EVEN and other is EVEN:
            return EVEN
        if self is ODD and other is ODD:
            return EVEN
        return ODD
We also need to fill in the other cases where the operands are top or bottom. In this case, they are both "contagious"; if either operand is bottom, the result is as well. If neither is bottom but either operand is top, the result is as well.
Now let's look at lshift. Shifting any number left by a non-zero number of
bits will always result in an even number, but we need to be careful about the
zero case! Shifting by zero doesn't change the number at all. Unfortunately,
since our lattice has no notion of zero, we have to over-approximate here:
class Parity:
    # ...
    def lshift(self, other):
        # self << other
        if other is ODD:
            return EVEN
        return TOP
This means that we will miss some opportunities to optimize, but it's a tradeoff that's just part of the game. (We could also add more elements to our lattice, but that's a topic for another day.)
Now, if we run our abstract interpretation, we'll collect some interesting
properties about the program. If we temporarily hack on the internals of
bb_to_str, we can print out parity information alongside the IR operations:
v0:top = getarg(0)
v1:top = getarg(1)
v2:even = lshift(v0, 1)
v3:even = lshift(v1, 1)
v4:even = add(v2, v3)
v5:top = dummy(v4)
This is pretty awesome, because we can see that v4, the result of the
addition, is always even. Maybe we can do something with that information.
Optimization
One way that a program might check if a number is odd is by checking the least
significant bit. This is a common pattern in C code, where you might see code
like y = x & 1. Let's introduce a bitand IR operation that acts like the
& operator in C/Python. Here is an example of use of it in our program:
v0 = getarg(0)
v1 = getarg(1)
v2 = lshift(v0, 1)
v3 = lshift(v1, 1)
v4 = add(v2, v3)
v5 = bitand(v4, 1)  # new!
v6 = dummy(v5)
We'll hold off on implementing the transfer function for it---that's left as an exercise for the reader---and instead do something different.
Instead, we'll see if we can optimize operations of the form bitand(X, 1). If
we statically know the parity as a result of abstract interpretation, we can
replace the bitand with a constant 0 or 1.
We'll first modify the analyze function (and rename it) to return a new
Block containing optimized instructions:
def simplify(block: Block) -> Block:
    parity = {v: BOTTOM for v in block}

    def parity_of(value):
        if isinstance(value, Constant):
            return Parity.const(value)
        return parity[value]

    result = Block()
    for op in block:
        # TODO: Optimize op
        # Emit
        result.append(op)
        # Analyze
        transfer = getattr(Parity, op.name)
        args = [parity_of(arg.find()) for arg in op.args]
        parity[op] = transfer(*args)
    return result
We're approaching this the way that PyPy does things under the hood, which is all in roughly a single pass. It tries to optimize an instruction away, and if it can't, it copies it into the new block.
Now let's add in the bitand optimization. It's mostly some gross-looking
pattern matching that checks if the right hand side of a bitwise and
operation is 1 (TODO: the left hand side, too). CF had some neat ideas on how
to make this more ergonomic, which I might save for later.3
Then, if we know the parity, optimize the bitand into a constant.
def simplify(block: Block) -> Block:
    parity = {v: BOTTOM for v in block}

    def parity_of(value):
        if isinstance(value, Constant):
            return Parity.const(value)
        return parity[value]

    result = Block()
    for op in block:
        # Try to simplify
        if isinstance(op, Operation) and op.name == "bitand":
            arg = op.arg(0)
            mask = op.arg(1)
            if isinstance(mask, Constant) and mask.value == 1:
                if parity_of(arg) is EVEN:
                    op.make_equal_to(Constant(0))
                    continue
                elif parity_of(arg) is ODD:
                    op.make_equal_to(Constant(1))
                    continue
        # Emit
        result.append(op)
        # Analyze
        transfer = getattr(Parity, op.name)
        args = [parity_of(arg.find()) for arg in op.args]
        parity[op] = transfer(*args)
    return result
Remember: because we use union-find to rewrite instructions in the optimizer
(make_equal_to), later uses of the same instruction get the new
optimized version "for free" (find).
Let's see how it works on our IR:
v0 = getarg(0)
v1 = getarg(1)
v2 = lshift(v0, 1)
v3 = lshift(v1, 1)
v4 = add(v2, v3)
v6 = dummy(0)
Hey, neat! bitand disappeared and the argument to dummy is now the constant
0 because we know the lowest bit.
Wrapping up
Hopefully you have gained a little bit of an intuitive understanding of abstract interpretation. Last year, being able to write some code made me more comfortable with the math. Now being more comfortable with the math is helping me write the code. It's nice upward spiral.
The two abstract domains we used in this post are simple and not very useful in practice but it's possible to get very far using slightly more complicated abstract domains. Common domains include: constant propagation, type inference, range analysis, effect inference, liveness, etc. For example, here is a a sample lattice for constant propagation:
It has multiple levels to indicate more and less precision. For example, you
might learn that a variable is either 1 or 2 and be able to encode that as
nonnegative instead of just going straight to top.
Check out some real-world abstract interpretation in open source projects:
- Known bits in LLVM
- Constant range in LLVM
- But I am told that the ranges don't form a lattice (see Interval Analysis and Machine Arithmetic: Why Signedness Ignorance Is Bliss)
- Tristate numbers for known bits in Linux eBPF
- Range analysis in Linux eBPF
- GDB prologue analysis of assembly to understand the stack and find frame pointers without using DWARF (some docs)
If you have some readable examples, please share them so I can add.
Acknowledgements
Thank you to CF Bolz-Tereick for the toy optimizer and helping edit this post!
-
In the words of abstract interpretation researchers Vincent Laviron and Francesco Logozzo in their paper Refining Abstract Interpretation-based Static Analyses with Hints (APLAS 2009):
The three main elements of an abstract interpretation are: (i) the abstract elements ("which properties am I interested in?"); (ii) the abstract transfer functions ("which is the abstract semantics of basic statements?"); and (iii) the abstract operations ("how do I combine the abstract elements?").
We don't have any of these "abstract operations" in this post because there's no control flow but you can read about them elsewhere! ↩
-
These abstract values are arranged in a lattice, which is a mathematical structure with some properties but the most important ones are that it has a top, a bottom, a partial order, a meet operation, and values can only move in one direction on the lattice.
Using abstract values from a lattice promises two things:
- The analysis will terminate
- The analysis will be correct for any run of the program, not just one sample run
-
Something about
__match_args__and@property... ↩
Mining JIT traces for missing optimizations with Z3
In my last post I've described how to use Z3 to find simple local peephole
optimization patterns
for the integer operations in PyPy's JIT. An example is int_and(x, 0) ->
0. In this post I want to scale up the problem of identifying possible
optimizations to much bigger instruction sequences, also using Z3. For that, I
am starting with the JIT traces of real benchmarks, after they have been
optimized by the optimizer of PyPy's JIT. Then we can ask Z3 to find
inefficient integer operations in those traces.
Starting from the optimized traces of real programs has some big advantages over the "classical" superoptimization approach of generating and then trying all possible sequences of instructions. It avoids the combinatorial explosion that happens with the latter approach. Also, starting from the traces of benchmarks or (even better) actual programs makes sure that we actually care about the missing optimizations that are found in this way. And because the traces are analyzed after they have been optimized by PyPy's optimizer, we only get reports for missing optimizations, that the JIT isn't able to do (yet).
The techniques and experiments I describe in this post are again the result of a bunch of discussions with John Regehr at a conference a few weeks ago, as well as reading his blog posts and papers. Thanks John! Also thanks to Max Bernstein for super helpful feedback on the drafts of this blog post (and for poking me to write things in general).
High-Level Approach
The approach that I took works as follows:
- Run benchmarks or other interesting programs and then dump the IR of the JIT traces into a file. The traces have at that point been already optimized by the PyPy JIT's optimizer.
- For every trace, ignore all the operations on non-integer variables.
- Translate every integer operation into a Z3 formula.
- For every operation, use Z3 to find out whether the operation is redundant (how that is done is described below).
- If the operation is redundant, the trace is less efficient than it could have been, because the optimizer could also have removed the operation. Report the inefficiency.
- Minimize the inefficient programs by removing as many operations as possible to make the problem easier to understand.
In the post I will describe the details and show some pseudocode of the approach. I'll also make the proper code public eventually (but it needs a healthy dose of cleanups first).
Dumping PyPy Traces
PyPy will write its JIT traces into the file out if the environment variable
PYPYLOG is set as follows:
PYPYLOG=jit-log-opt:out pypy <program.py>
This environment variable works for PyPy, but also for other virtual machines built with RPython.
(This is really a side point for the rest of the blog post, but since the
question came up I wanted to clarify it: Operations on integers in the Python
program that the JIT is running don't all correspond 1-to-1 with the int_...
operations in the traces. The int_... trace operations always operate on
machine words. The Python int type supports arbitrarily large integers. PyPy
will optimistically try to lower the operations on Python integers into machine
word operations, but adds the necessary guards into the trace to make sure that
overflow outside of the range of machine words is caught. In case one of these
guards fails the interpreter switches to a big integer heap-allocated
representation.)
Encoding Traces as Z3 formulas
The last blog post already contained the code to encode the results of
individual trace operations into Z3 formulas, so we don't need to repeat that
here. To encode traces of operations we introduce a Z3 variable for every
operation in the trace and then call the z3_expression function for every
single one of the operations in the trace.
For example, for the following trace:
[i1]
i2 = uint_rshift(i1, 32)
i3 = int_and(i2, 65535)
i4 = uint_rshift(i1, 48)
i5 = int_lshift(i4, 16)
i6 = int_or(i5, i3)
jump(i6, i2) # equal
We would get the Z3 formula:
z3.And(i2 == LShR(i1, 32),
       i3 == i2 & 65535,
       i4 == LShR(i1, 48),
       i5 == i4 << 16)
Usually we won't ask for the formula of the whole trace at once. Instead we go through the trace operation by operation and try to find inefficiencies in the current one we are looking at. Roughly like this (pseudo-)code:
def newvar(name):
    return z3.BitVec(name, INTEGER_WIDTH)

def find_inefficiencies(trace):
    solver = z3.Solver()
    var_to_z3var = {}
    for input_argument in trace.inputargs:
        var_to_z3var[input_argument] = newz3var(input_argument)
    for op in trace:
        var_to_z3var[op] = z3resultvar = newz3var(op.resultvarname)
        arg0 = op.args[0]
        z3arg0 = var_to_z3var[arg0]
        if len(op.args) == 2:
            arg1 = op.args[1]
            z3arg1 = var_to_z3var[arg1]
        else:
            z3arg1 = None
        res, valid_if = z3_expression(op.name, z3arg0, z3arg1)
        # checking for inefficiencies, see the next sections
        ...
        if ...:
            return "inefficient", op

        # not inefficient, assert op into the solver and continue with the next op
        solver.add(z3resultvar == res)
    return None # no inefficiency found
Identifying constant booleans with Z3
To get started finding inefficiencies in a trace, we can first focus on boolean variables. For every operation in the trace that returns a bool we can ask Z3 to prove that this variable must be always True or always False. Most of the time, neither of these proofs will succeed. But if Z3 manages to prove one of them, we know have found an ineffiency: instead of computing the boolean result (eg by executing a comparison) the JIT's optimizer could have replaced the operation with the corresponding boolean constant.
Here's an example of an inefficiency found that way: if x < y and y < z are
both true, PyPy's JIT could conclude that x < z must also
be true. However, currently the JIT cannot make that conclusion because it
only reasons about the concrete ranges (lower and upper bounds) for every
integer variable, but it has no way to remember anything about relationships
between different variables. This kind of reasoning would quite often be useful
to remove list/string bounds checks. Here's a talk about how LLVM does
this (but it might be
too heavyweight for a JIT setting).
Here are some more examples found that way:
-
x - 1 == xis always False -
x - (x == -1) == -1is always False. The patternx - (x == -1)happens a lot in PyPy's hash computations: To be compatible with the CPython hashes we need to make sure that no object's hash is -1 (CPython uses -1 as an error value on the C level).
Here's pseudo-code for how to implement checking boolean operations for inefficiencies:
def find_inefficiencies(trace):
    ...
    for op in trace:
        ...
        res, valid_if = z3_expression(op.name, z3arg0, z3arg1)
        # check for boolean constant result
        if op.has_boolean_result():
            if prove(solver, res == 0):
                return "inefficient", op, 0
            if prove(solver, res == 1):
                return "inefficient", op, 1
        # checking for other inefficiencies, see the next sections
        ...

        # not inefficient, add op to the solver and continue with the next op
        solver.add(z3resultvar == res)
    return None # no inefficiency found
Identifying redundant operations
A more interesting class of redundancy is to try to find two operations in a trace that compute the same result. We can do that by asking Z3 to prove for each pair of different operations in the trace to prove that the result is always the same. If a previous operation returns the same result, the JIT could have reused that result instead of re-computing it, saving time. Doing this search for equivalent operations with Z3 is quadratic in the number of operations, but since traces have a maximum length it is not too bad in practice.
This is the real workhorse of my script so far, it's what finds most of the inefficiencies. Here's a few examples:
- The very first and super useful example the script found is
int_eq(b, 1) == bifbis known to be a boolean (ie and integer 0 or 1). I have already implemented this optimization in the JIT. - Similarly,
int_and(b, 1) == bfor booleans. (x << 4) & -0xf == x << 4-
((x >> 63) << 1) << 2) >> 3 == x >> 63. In general the JIT is quite bad at optimizing repeated shifts (the infrastructure for doing better with that is already in place, so this will be a relatively easy fix). -
(x & 0xffffffff) | ((x >> 32) << 32) == x. Having the JIT optimize this would maybe require first recognizing that(x >> 32) << 32can be expressed as a mask:(x & 0xffffffff00000000), and then using(x & c1) | (x & c2) == x & (c1 | c2) - A commonly occurring pattern is variations of this one:
((x & 1345) ^ 2048) - 2048 == x & 1345(with different constants, of course). xor is add without carry, andx & 1345does not have the bit2048set. Therefore the^ 2048is equivalent to+ 2048, which the- 2048cancels. More generally, ifa & b == 0, thena + b == a | b == a ^ b. I don't understand at all why this appears so often in the traces, but I see variations of it a lot. LLVM can optimize this, but GCC can't, thanks to Andrew Pinski for filing the bug!
And here's some implementation pseudo-code again:
def find_inefficiencies(trace):
    ...
    for op in trace:
        ...
        res, valid_if = z3_expression(op.name, z3arg0, z3arg1)
        # check for boolean constant result
        ...
        # searching for redundant operations
        for previous_op in trace:
            if previous_op is op:
                break # done, reached the current op
            previous_op_z3var = var_to_z3var[previous_op]
            if prove(solver, previous_op_z3var == res):
                return "inefficient", op, previous_op
        ...
        # more code here later
        ...

        # not inefficient, add op to the solver and continue with the next op
        solver.add(z3resultvar == res)
    return None # no inefficiency found
Synthesizing more complicated constants with exists-forall
To find out whether some integer operations always return a constant result, we
can't simply use the same trick as for those operations that return boolean
results, because enumerating 2⁶⁴ possible constants and checking them all
would take too long. Like in the last post, we can use z3.ForAll to find out
whether Z3 can synthesize a constant for the result of an operation for us.
If such a constant exists, the JIT could have removed the operation,
and replaced it with the constant that Z3 provides.
Here a few examples of inefficiencies found this way:
-
(x ^ 1) ^ x == 1(or, more generally:(x ^ y) ^ x == y) - if
x | y == 0, it follows thatx == 0andy == 0 - if
x != MAXINT, thenx + 1 > x
Implementing this is actually slightly annoying. The solver.add calls for
non-inefficient ops add assertions to the solver, which are now confusing the
z3.ForAll query. We could remove all assertion from the solver, then do the
ForAll query, then add the assertions back. What I ended doing instead was
instantiating a second solver object that I'm using for the ForAll queries,
that remains empty the whole time.
def find_inefficiencies(trace):
    solver = z3.Solver()
    empty_solver = z3.Solver()
    var_to_z3var = {}
    ...
    for op in trace:
        ...
        res, valid_if = z3_expression(op.name, z3arg0, z3arg1)
        # check for boolean constant result
        ...
        # searching for redundant operations
        ...
        # checking for constant results
        constvar = z3.BitVec('find_const', INTEGER_WIDTH)
        condition = z3.ForAll(
            var_to_z3var.values(),
            z3.Implies(
                *solver.assertions(),
                expr == constvar
            )
        )
        if empty_solver.check(condition) == z3.sat:
            model = empty_solver.model()
            const = model[constvar].as_signed_long()
            return "inefficient", op, const

        # not inefficient, add op to the solver and continue with the next op
        solver.add(z3resultvar == res)
    return None # no inefficiency found
Minimization
Analyzing an inefficiency by hand in the context of a larger trace is quite tedious. Therefore I've implemented a (super inefficient) script to try to make the examples smaller. Here's how that works:
- First throw out all the operations that occur after the inefficient operation in the trace.
- Then we remove all "dead" operations, ie operations that don't have their results used (all the operations that we can analyze with Z3 are without side effects).
- Now we try to remove every guard in the trace one by one and check afterwards, whether the resulting trace still has an inefficiency.
- We also try to replace every single operation with a new argument to the trace, to see whether the inefficiency is still present.
The minimization process is sort of inefficient and I should probably be using shrinkray or C-Reduce instead. However, it seems to work well in practice and the runtime isn't too bad.
Results
So far I am using the JIT traces of three programs: 1) Booting Linux on the Pydrofoil RISC-V emulator, 2) booting Linux on the Pydrofoil ARM emulator, and 3) running the PyPy bootstrap process on top of PyPy.
I picked these programs because most Python programs don't contain interesting amounts of integer operations, and the traces of the emulators contain a lot of them. I also used the bootstrap process because I still wanted to try a big Python program and personally care about the runtime of this program a lot.
The script identifies 94 inefficiencies in the traces, a lot of them come from repeating patterns. My next steps will be to manually inspect them all, categorize them, and implement easy optimizations identified that way. I also want a way to sort the examples by execution count in the benchmarks, to get a feeling for which of them are most important.
I didn't investigate the full set of Python benchmarks that PyPy uses yet, because I don't expect them to contain interesting amounts of integer operations, but maybe I am wrong about that? Will have to try eventually.
Conclusion
This was again much easier to do than I would have expected! Given that I had the translation of trace ops to Z3 already in place, it was a matter of about a day's of programming to use this infrastructure to find the first problems and minimizing them.
Reusing the results of existing operations or replacing operations by constants can be seen as "zero-instruction superoptimization". I'll probably be rather busy for a while to add the missing optimizations identified by my simple script. But later extensions to actually synthesize one or several operations in the attempt to optimize the traces more and find more opportunities should be possible.
Finding inefficiencies in traces with Z3 is significantly less annoying and also less error-prone than just manually inspecting traces and trying to spot optimization opportunities.
Random Notes and Sources
Again, John's blog posts:
- Let’s Work on an LLVM Superoptimizer
- Early Superoptimizer Results
- A Few Synthesizing Superoptimizer Results
- Synthesizing Constants
and papers:
I remembered recently that I had seen the approach of optimizing the traces of a tracing JIT with Z3 a long time ago, as part of the (now long dead, I think) SPUR project. There's a workshop paper from 2010 about this. SPUR was trying to use Z3 built into the actual JIT (as opposed to using Z3 only to find places where the regular optimizers could be improved). In addition to bitvectors, SPUR also used the Z3 support for arrays to model the C# heap and remove redundant stores. This is still another future extension for all the Z3 work I've been doing in the context of the PyPy JIT.
Finding Simple Rewrite Rules for the JIT with Z3
In June I was at the PLDI conference in Copenhagen to present a paper I co-authored with Max Bernstein. I also finally met John Regehr, who I'd been talking on social media for ages but had never met. John has been working on compiler correctness and better techniques for building compilers and optimizers since a very long time. The blog post Finding JIT Optimizer Bugs using SMT Solvers and Fuzzing was heavily inspired by this work. We talked a lot about his and his groups work on using Z3 for superoptimization and for finding missing optimizations. I have applied some of the things John told me about to the traces of PyPy's JIT, and wanted to blog about that. However, my draft felt quite hard to understand. Therefore I have now written this current post, to at least try to provide a somewhat gentler on-ramp to the topic.
In this post we will use the Python-API to Z3 to find local peephole rewrite rules for the operations in the intermediate representation of PyPy's tracing JIT. The code for this is simple enough that we can go through all of it.
The PyPy JIT produces traces of machine level instructions, which are optimized
and then turned into machine code. The optimizer uses a number of approaches to
make the traces more efficient. For integer operations it applies a number of
arithmetic simplification rules rules, for example int_add(x, 0) -> x. When
implementing these rules in the JIT there are two problems: How do we know
that the rules are correct? And how do we know that we haven't forgotten any
rules? We'll try to answer both of these, but the first one in particular.
We'll be using Z3, a satisfiability module theories (SMT) solver which has good bitvector support and most importantly an excellent Python API. We can use the solver to reason about bitvectors, which are how we will model machine integers.
To find rewrite rules, we will consider the binary operations (i.e. those
taking two arguments) in PyPy traces that take and produce integers. The
completely general form op(x, y) is not simplifiable on its own. But if
either x == y
or if one of the arguments is a constant, we can potentially simplify the
operation into a simpler form. The results are either the variable x, or a
(potentially different) constant. We'll ignore constant-folding where both
arguments of the binary operation are constants. The possible results for a
simplifiable binary operation are the variable x or another constant. This
leaves the following patterns as possibilities:
op(x, x) == xop(x, x) == c1op(x, c1) == xop(c1, x) == xop(x, c1) == c2op(c1, x) == c2
Our approach will be to take every single supported binary integer operation,
instantiate all of these patterns, and try to ask Z3 whether the resulting
simplification is valid for all values of x.
Quick intro to the Z3 Python-API
Here's a terminal session showing the use of the Z3 Python API:
>>>> import z3
>>>> # construct a Z3 bitvector variable of width 8, with name x:
>>>> x = z3.BitVec('x', 8)
>>>> # construct a more complicated formula by using operator overloading:
>>>> x + x
x + x
>>>> x + 1
x + 1
Z3 checks the "satisfiability" of a formula. This means that it tries to find an example set of concrete values for the variables that occur in a formula, such that the formula becomes true. Examples:
>>>> solver = z3.Solver()
>>>> solver.check(x * x == 3)
unsat
>>>> # meaning no x fulfils this property
>>>>
>>>> solver.check(x * x == 9)
sat
>>>> model = solver.model()
>>>> model
[x = 253]
>>>> model[x].as_signed_long()
-3
>>>> # 253 is the same as -3 in two's complement arithmetic with 8 bits
In order to use Z3 to prove something, we can ask Z3 to find counterexamples for the statement, meaning concrete values that would make the negation of the statement true:
>>>> solver.check(z3.Not(x ^ -1 == ~x))
unsat
The result unsat means that we just proved that x ^ -1 == ~x is true for
all x, because there is no value for x that makes not (x ^ -1 == ~x)
true (this works because -1 has all the bits set).
If we try to prove something incorrect in this way, the following happens:
>>>> solver.check(z3.Not(x ^ -1 == x))
sat
sat shows that x ^ -1 == x is (unsurprisingly) not always true, and we can
ask for a counterexample:
>>>> solver.model()
[x = 0]
This way of proving this works because the check calls try to solve an
(implicit) "exists" quantifier, over all the Z3 variables used in the formula.
check will either return z3.unsat, which means that no concrete values make
the formula true; or z3.sat, which means that you can get some concrete
values that make the formula true by calling solver.model().
In math terms we prove things using check by de-Morgan's rules for quantifiers:
$$ \lnot \exists x: \lnot f(x) \implies \forall x: f(x) $$
Now that we've seen the basics of using the Z3 API on a few small examples, we'll use it in a bigger program.
Encoding the integer operations of RPython's JIT into Z3 formulas
Now we'll use the API to reason about the integer operations of the PyPy JIT intermediate representation (IR). The binary integer operations are:
opnames2 = [
"int_add",
"int_sub",
"int_mul",
"int_and",
"int_or",
"int_xor",
"int_eq",
"int_ne",
"int_lt",
"int_le",
"int_gt",
"int_ge",
"uint_lt",
"uint_le",
"uint_gt",
"uint_ge",
"int_lshift",
"int_rshift",
"uint_rshift",
"uint_mul_high",
"int_pydiv",
"int_pymod",
]
There's not much special about the integer operations. Like in LLVM, most of
them are signedness-independent: int_add, int_sub, int_mul, ... work
correctly for unsigned integers but also for
two's-complement signed
integers. Exceptions for that are order comparisons like int_lt etc. for
which we have unsigned variants uint_lt etc. All operations that produce a
boolean result return a full-width integer 0 or 1 (the PyPy JIT supports
only word-sized integers in its intermediate representation)
In order to reason about the IR operations, some ground work:
import z3

INTEGER_WIDTH = 64
solver = z3.Solver()
solver.set("timeout", 10000) # milliseconds, ie 10s
xvar = z3.BitVec('x', INTEGER_WIDTH)
constvar = z3.BitVec('const', INTEGER_WIDTH)
constvar2 = z3.BitVec('const2', INTEGER_WIDTH)
TRUEBV = z3.BitVecVal(1, INTEGER_WIDTH)
FALSEBV = z3.BitVecVal(0, INTEGER_WIDTH)
And here's the a function to turn an integer IR operation of PyPy's JIT into Z3 formulas:
def z3_expression(opname, arg0, arg1=None):
    """ computes a tuple of (result, valid_if) of Z3 formulas. `result` is the
    formula representing the result of the operation, given argument formulas
    arg0 and arg1. `valid_if` is a pre-condition that must be true for the
    result to be meaningful. """
    result = None
    valid_if = True # the precondition is mostly True, with few exceptions
    if opname == "int_add":
        result = arg0 + arg1
    elif opname == "int_sub":
        result = arg0 - arg1
    elif opname == "int_mul":
        result = arg0 * arg1
    elif opname == "int_and":
        result = arg0 & arg1
    elif opname == "int_or":
        result = arg0 | arg1
    elif opname == "int_xor":
        result = arg0 ^ arg1
    elif opname == "int_eq":
        result = cond(arg0 == arg1)
    elif opname == "int_ne":
        result = cond(arg0 != arg1)
    elif opname == "int_lt":
        result = cond(arg0 < arg1)
    elif opname == "int_le":
        result = cond(arg0 <= arg1)
    elif opname == "int_gt":
        result = cond(arg0 > arg1)
    elif opname == "int_ge":
        result = cond(arg0 >= arg1)
    elif opname == "uint_lt":
        result = cond(z3.ULT(arg0, arg1))
    elif opname == "uint_le":
        result = cond(z3.ULE(arg0, arg1))
    elif opname == "uint_gt":
        result = cond(z3.UGT(arg0, arg1))
    elif opname == "uint_ge":
        result = cond(z3.UGE(arg0, arg1))
    elif opname == "int_lshift":
        result = arg0 << arg1
        valid_if = z3.And(arg1 >= 0, arg1 < INTEGER_WIDTH)
    elif opname == "int_rshift":
        result = arg0 << arg1
        valid_if = z3.And(arg1 >= 0, arg1 < INTEGER_WIDTH)
    elif opname == "uint_rshift":
        result = z3.LShR(arg0, arg1)
        valid_if = z3.And(arg1 >= 0, arg1 < INTEGER_WIDTH)
    elif opname == "uint_mul_high":
        # zero-extend args to 2*INTEGER_WIDTH bit, then multiply and extract
        # highest INTEGER_WIDTH bits
        zarg0 = z3.ZeroExt(INTEGER_WIDTH, arg0)
        zarg1 = z3.ZeroExt(INTEGER_WIDTH, arg1)
        result = z3.Extract(INTEGER_WIDTH * 2 - 1, INTEGER_WIDTH, zarg0 * zarg1)
    elif opname == "int_pydiv":
        valid_if = arg1 != 0
        r = arg0 / arg1
        psubx = r * arg1 - arg0
        result = r + (z3.If(arg1 < 0, psubx, -psubx) >> (INTEGER_WIDTH - 1))
    elif opname == "int_pymod":
        valid_if = arg1 != 0
        r = arg0 % arg1
        result = r + (arg1 & z3.If(arg1 < 0, -r, r) >> (INTEGER_WIDTH - 1))
    elif opname == "int_is_true":
        result = cond(arg0 != FALSEBV)
    elif opname == "int_is_zero":
        result = cond(arg0 == FALSEBV)
    elif opname == "int_neg":
        result = -arg0
    elif opname == "int_invert":
        result = ~arg0
    else:
        assert 0, "unknown operation " + opname
    return result, valid_if

def cond(z3expr):
    """ helper function to turn a Z3 boolean result z3expr into a 1 or 0
    bitvector, using z3.If """
    return z3.If(z3expr, TRUEBV, FALSEBV)
We map the semantics of a PyPy JIT operation to Z3 with the z3_expression
function. It takes the name of a JIT operation and its two (or one) arguments
into a pair of Z3 formulas, result and valid_if. The resulting formulas are
constructed with the operator overloading of Z3 variables/formulas.
The first element result of the result of z3_expression represents the result
of performing the operation. valid_if is a bool that represents a condition that
needs to be True in order for the result of the operation to be defined. E.g.
int_pydiv(a, b) is only valid if b != 0. Most operations are always valid,
so they return True as that condition (we'll ignore valid_if for a bit, but it
will become more relevant further down in the post).
We can define a helper function to prove things by finding counterexamples:
def prove(cond):
    """ Try to prove a condition cond by searching for counterexamples of its negation. """
    z3res = solver.check(z3.Not(cond))
    if z3res == z3.unsat:
        return True
    elif z3res == z3.unknown: # eg on timeout
        return False
    elif z3res == z3.sat:
        return False
    assert 0, "should be unreachable"
Finding rewrite rules
Now we can start finding our first rewrite rules, following the first pattern
op(x, x) -> x. We do this by iterating over all the supported binary
operation names, getting the z3 expression for op(x, x) and then asking Z3 to
prove op(x, x) == x.
for opname in opnames2:
    result, valid_if = z3_expression(opname, xvar, xvar)
    if prove(result == xvar):
        print(f"{opname}(x, x) -> x, {result}")
This yields the simplifications:
int_and(x, x) -> x
int_or(x, x) -> x
Synthesizing constants
Supporting the next patterns is harder: op(x, x) == c1, op(x, c1) == x, and
op(c1, x) == x. We don't know which constants to pick to try to get Z3 to
prove the equality. We could iterate over common constants like 0, 1,
MAXINT, etc, or even over all the 256 values for a bitvector of length 8.
However, we will instead ask Z3 to find the constants for us too.
This can be done by using quantifiers, in this case z3.ForAll. The query we
pose to Z3 is "does there exist a constant c1 such that for all x the
following is true: op(x, c1) == x? Note that the constant c1 is not
necessarily unique, there could be many of them. We generate several matching
constant, and add that they must be different to the condition of the second
and further queries.
We can express this in a helper function:
def find_constant(z3expr, number_of_results=5):
    condition = z3.ForAll(
        [xvar],
        z3expr
    )
    for i in range(number_of_results):
        checkres = solver.check(condition)
        if checkres == z3.sat:
            # if a solver check succeeds, we can ask for a model, which is
            # concrete values for the variables constvar
            model = solver.model()
            const = model[constvar].as_signed_long()
            yield const
            # make sure we don't generate the same constant again on the
            # next call
            condition = z3.And(constvar != const, condition)
        else:
            # no (more) constants found
            break
We can use this new function for the three mentioned patterns:
# try to find constants for op(x, x) == c
for opname in opnames2:
    result, valid_if = z3_expression(opname, xvar, xvar)
    for const in find_constant(result == constvar):
        print(f"{opname}(x, x) -> {const}")
# try to find constants for op(x, c) == x and op(c, x) == x
for opname in opnames2:
    result, valid_if = z3_expression(opname, xvar, constvar)
    for const in find_constant(result == xvar):
        print(f"{opname}(x, {const}) -> x")
    result, valid_if = z3_expression(opname, constvar, xvar)
    for const in find_constant(result == xvar):
        print(f"{opname}({const}, x) -> x")
# this code is not quite correct, we'll correct it later
Together this yields the following new simplifications:
# careful, these are not all correct!
int_sub(x, x) -> 0
int_xor(x, x) -> 0
int_eq(x, x) -> 1
int_ne(x, x) -> 0
int_lt(x, x) -> 0
int_le(x, x) -> 1
int_gt(x, x) -> 0
int_ge(x, x) -> 1
uint_lt(x, x) -> 0
uint_le(x, x) -> 1
uint_gt(x, x) -> 0
uint_ge(x, x) -> 1
uint_rshift(x, x) -> 0
int_pymod(x, x) -> 0
int_add(x, 0) -> x
int_add(0, x) -> x
int_sub(x, 0) -> x
int_mul(x, 1) -> x
int_mul(1, x) -> x
int_and(x, -1) -> x
int_and(-1, x) -> x
int_or(x, 0) -> x
int_or(0, x) -> x
int_xor(x, 0) -> x
int_xor(0, x) -> x
int_lshift(x, 0) -> x
int_rshift(x, 0) -> x
uint_rshift(x, 0) -> x
int_pydiv(x, 1) -> x
int_pymod(x, 0) -> x
Most of these look good at first glance, but the last one reveals a problem:
we've been ignoring the valid_if expression up to now. We can stop doing that by
changing the code like this, which adds z3.And(valid_if, ...) to the argument of
the calls to find_constant:
# try to find constants for op(x, x) == c, op(x, c) == x and op(c, x) == x
for opname in opnames2:
    result, valid_if = z3_expression(opname, xvar, xvar)
    for const in find_constant(z3.And(valid_if, result == constvar)):
        print(f"{opname}(x, x) -> {const}")
# try to find constants for op(x, c) == x and op(c, x) == x
for opname in opnames2:
    result, valid_if = z3_expression(opname, xvar, constvar)
    for const in find_constant(z3.And(result == xvar, valid_if)):
        print(f"{opname}(x, {const}) -> x")
    result, valid_if = z3_expression(opname, constvar, xvar)
    for const in find_constant(z3.And(result == xvar, valid_if)):
        print(f"{opname}({const}, x) -> x")
And we get this list instead:
int_sub(x, x) -> 0
int_xor(x, x) -> 0
int_eq(x, x) -> 1
int_ne(x, x) -> 0
int_lt(x, x) -> 0
int_le(x, x) -> 1
int_gt(x, x) -> 0
int_ge(x, x) -> 1
uint_lt(x, x) -> 0
uint_le(x, x) -> 1
uint_gt(x, x) -> 0
uint_ge(x, x) -> 1
int_add(x, 0) -> x
int_add(0, x) -> x
int_sub(x, 0) -> x
int_mul(x, 1) -> x
int_mul(1, x) -> x
int_and(x, -1) -> x
int_and(-1, x) -> x
int_or(x, 0) -> x
int_or(0, x) -> x
int_xor(x, 0) -> x
int_xor(0, x) -> x
int_lshift(x, 0) -> x
int_rshift(x, 0) -> x
uint_rshift(x, 0) -> x
int_pydiv(x, 1) -> x
Synthesizing two constants
For the patterns op(x, c1) == c2 and op(c1, x) == c2 we need to synthesize
two constants. We can again write a helper method for that:
def find_2consts(z3expr, number_of_results=5):
    condition = z3.ForAll(
        [xvar],
        z3expr
    )
    for i in range(number_of_results):
        checkres = solver.check(condition)
        if checkres == z3.sat:
            model = solver.model()
            const = model[constvar].as_signed_long()
            const2 = model[constvar2].as_signed_long()
            yield const, const2
            condition = z3.And(z3.Or(constvar != const, constvar2 != const2), condition)
        else:
            return
And then use it like this:
for opname in opnames2:
    # try to find constants c1, c2 such that op(c1, x) -> c2
    result, valid_if = z3_expression(opname, constvar, xvar)
    consts = find_2consts(z3.And(valid_if, result == constvar2))
    for const, const2 in consts:
        print(f"{opname}({const}, x) -> {const2}")
    # try to find constants c1, c2 such that op(x, c1) -> c2
    result, valid_if = z3_expression(opname, xvar, constvar)
    consts = find_2consts(z3.And(valid_if, result == constvar2))
    for const, const2 in consts:
        print("%s(x, %s) -> %s" % (opname, const, const2))
Which yields some straightforward simplifications:
int_mul(0, x) -> 0
int_mul(x, 0) -> 0
int_and(0, x) -> 0
int_and(x, 0) -> 0
uint_lt(x, 0) -> 0
uint_le(0, x) -> 1
uint_gt(0, x) -> 0
uint_ge(x, 0) -> 1
int_lshift(0, x) -> 0
int_rshift(0, x) -> 0
uint_rshift(0, x) -> 0
uint_mul_high(0, x) -> 0
uint_mul_high(1, x) -> 0
uint_mul_high(x, 0) -> 0
uint_mul_high(x, 1) -> 0
int_pymod(x, 1) -> 0
int_pymod(x, -1) -> 0
A few require a bit more thinking:
int_or(-1, x) -> -1
int_or(x, -1) -> -1
The are true because in two's complement, -1 has all bits set.
The following ones require recognizing that -9223372036854775808 == -2**63 is
the most negative signed 64-bit integer, and 9223372036854775807 == 2 ** 63 -
1 is the most positive one:
int_lt(9223372036854775807, x) -> 0
int_lt(x, -9223372036854775808) -> 0
int_le(-9223372036854775808, x) -> 1
int_le(x, 9223372036854775807) -> 1
int_gt(-9223372036854775808, x) -> 0
int_gt(x, 9223372036854775807) -> 0
int_ge(9223372036854775807, x) -> 1
int_ge(x, -9223372036854775808) -> 1
The following ones are true because the bitpattern for -1 is the largest
unsigned number:
uint_lt(-1, x) -> 0
uint_le(x, -1) -> 1
uint_gt(x, -1) -> 0
uint_ge(-1, x) -> 1
Strength Reductions
All the patterns so far only had a variable or a constant on the target of the
rewrite. We can also use the machinery to do strengh-reductions where we
generate a single-argument operation op1(x) for input operations op(x, c1)
or op(c1, x). To achieve this, we try all combinations of binary and unary
operations. (We won't consider strength reductions where a binary operation
gets turned into a "cheaper" other binary operation here.)
opnames1 = [
"int_is_true",
"int_is_zero",
"int_neg",
"int_invert",
]

for opname in opnames2:
    for opname1 in opnames1:
        result, valid_if = z3_expression(opname, xvar, constvar)
        # try to find a constant op(x, c) == g(x)
        result1, valid_if1 = z3_expression(opname1, xvar)
        consts = find_constant(z3.And(valid_if, valid_if1, result == result1))
        for const in consts:
            print(f"{opname}(x, {const}) -> {opname1}(x)")

        # try to find a constant op(c, x) == g(x)
        result, valid_if = z3_expression(opname, constvar, xvar)
        result1, valid_if1 = z3_expression(opname1, xvar)
        consts = find_constant(z3.And(valid_if, valid_if1, result == result1))
        for const in consts:
            print(f"{opname}({const}, x) -> {opname1}(x)")
Which yields the following new simplifications:
int_sub(0, x) -> int_neg(x)
int_sub(-1, x) -> int_invert(x)
int_mul(x, -1) -> int_neg(x)
int_mul(-1, x) -> int_neg(x)
int_xor(x, -1) -> int_invert(x)
int_xor(-1, x) -> int_invert(x)
int_eq(x, 0) -> int_is_zero(x)
int_eq(0, x) -> int_is_zero(x)
int_ne(x, 0) -> int_is_true(x)
int_ne(0, x) -> int_is_true(x)
uint_lt(0, x) -> int_is_true(x)
uint_lt(x, 1) -> int_is_zero(x)
uint_le(1, x) -> int_is_true(x)
uint_le(x, 0) -> int_is_zero(x)
uint_gt(x, 0) -> int_is_true(x)
uint_gt(1, x) -> int_is_zero(x)
uint_ge(x, 1) -> int_is_true(x)
uint_ge(0, x) -> int_is_zero(x)
int_pydiv(x, -1) -> int_neg(x)
Conclusions
With not very little code we managed to generate a whole lot of local simplifications for integer operations in the IR of PyPy's JIT. The rules discovered that way are "simple", in the sense that they only require looking at a single instruction, and not where the arguments of that instruction came from. They also don't require any knowledge about the properties of the arguments of the instructions (e.g. that they are positive).
The rewrites in this post have mostly been in PyPy's JIT already. But now we
mechanically confirmed that they are correct. I've also added the remaining
useful looking ones, in particular int_eq(x, 0) -> int_is_zero(x) etc.
If we wanted to scale this approach up, we would have to work much harder! There are a bunch of problems that come with generalizing the approach to looking at sequences of instructions:
-
Combinatorial explosion: if we look at sequences of instructions, we very quickly get a combinatorial explosion and it becomes untractable to try all combinations.
-
Finding non-minimal patterns: Some complicated simplifications can be instances of simpler ones. For example, because
int_add(x, 0) -> x, it's also true thatint_add(int_sub(x, y), 0) -> int_sub(x, y). If we simply generate all possible sequences, we will find the latter simplification rule, which we would usually not care about. -
Unclear usefulness: if we simply generate all rewrites up to a certain number of instructions, we will get a lot of patterns that are useless in the sense that they typically aren't found in realistic programs. It would be much better to somehow focus on the patterns that real benchmarks are using.
In the next blog post I'll discuss an alternative approach to simply generating all possible sequences of instructions, that tries to address these problems. This works by analyzing the real traces of benchmarks and mining those for inefficiencies, which only shows problems that occur in actual programs.
Sources
I've been re-reading a lot of blog posts from John's blog:
- Let’s Work on an LLVM Superoptimizer
- Early Superoptimizer Results
- A Few Synthesizing Superoptimizer Results
- Synthesizing Constants
but also papers:
Another of my favorite blogs has been Philipp Zucker's blog in the last year or two, lots of excellent posts about/using Z3 on there.
Profiling PyPy using the Firefox profiler user interface
Introduction
If you ever wanted to profile your Python code on PyPy, you probably came across VMProf — a statistical profiler for PyPy.
VMProf's console output can already give some insights into where your code spends time, but it is far from showing all the information captured while profiling.
There have been some tools around to visualize VMProf's output. Unfortunately the vmprof.com user interface is no longer available and vmprof-server is not as easy to use, you may want to take a look at a local viewer or converter. Those so far could give you some general visualizations of your profile, but do not show any PyPy related context like PyPy's log output (PyPyLog, which is output when using the PYPYLOG environment variable to log JIT actions).
To bring all of those features together in one tool, you may take a look at the vmprof-firefox-converter.
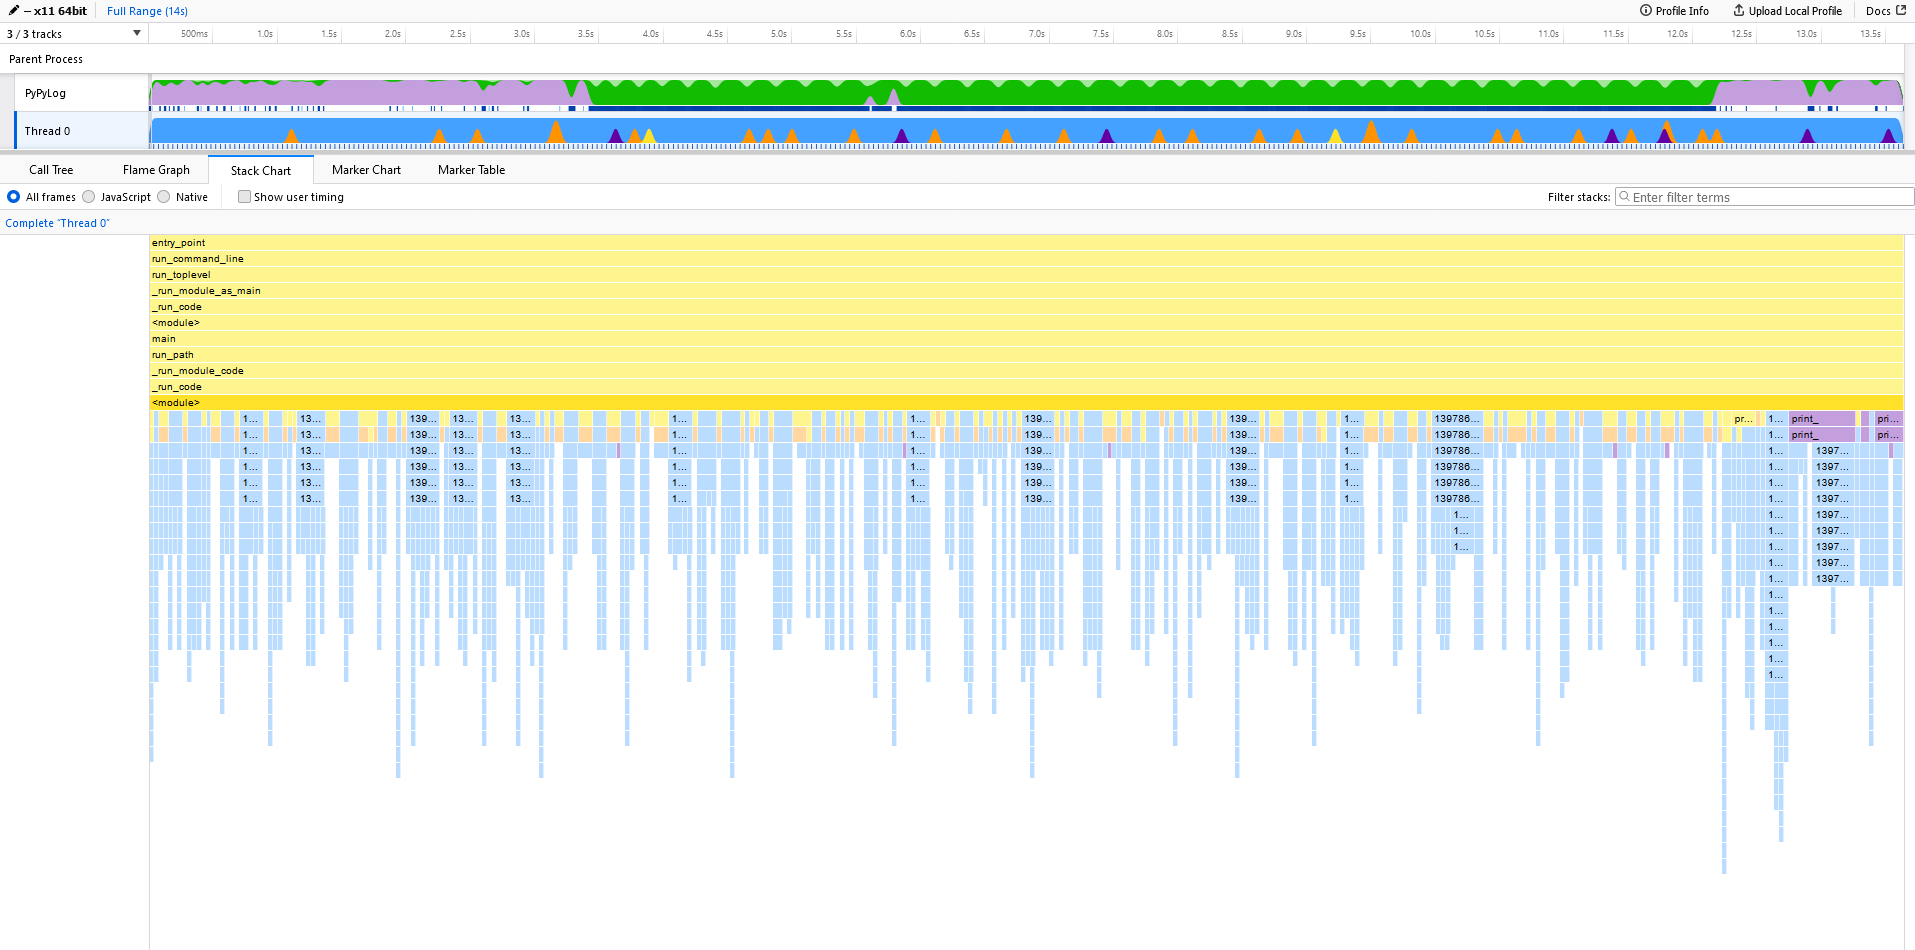
Created in the context of my bachelor's thesis, the vmprof-firefox-converter is a tool for analyzing VMProf profiles with the Firefox profiler user interface. Instead of building a new user interface from scratch, this allows us to reuse the user interface work Mozilla put into the Firefox profiler. The Firefox profiler offers a timeline where you can zoom into profiles and work with different visualizations like a flame graph or a stack chart. To understand why there is time spent inside a function, you can revisit the source code and even dive into the intermediate representation of functions executed by PyPy's just-in-time compiler. Additionally, there is a visualization for PyPy's log output, to keep track whether PyPy spent time inside the interpreter, JIT or GC throughout the profiling time.
Profiling word count
In this blog post, I want to show an example of how to use the vmprof-firefox-converter for a simple Python program. Based on Ben Hoyt's blog Performance comparison: counting words in Python, Go, C++, C, AWK, Forth, and Rust we will profile two python versions of a word counter running on PyPy. One being a bit more optimized. For this, VMProf will be used, but instead of just going with the console output, we will use the Firefox profiler user interface.
At first, we are going to look at a simple way of counting words with Collections.Counter.
This will read one line from the standard input at a time and count the words with counter.update()
counts = collections.Counter()
for line in sys.stdin:
    words = line.lower().split()
    counts.update(words)

for word, count in counts.most_common():
    print(word, count)
To start profiling, simply execute:
pypy -m vmprofconvert -run simple.py <kjvbible_x10.txt
This will run the above code with vmprof, automatically capture and convert the results and finally open the Firefox profiler.
The input file is the king James version of the bible concatenated ten times.
To get started, we take a look at the call stack.
 Here we see that most of the time is spent in native code (marked as blue) e.g., the
 counter.update() or split() C implementation.
Now let's proceed with the more optimized version.
This time we read 64 Kb of data from the standard input and count the words with counter.update().
counts = collections.Counter()
remaining = ''
while True:
    chunk = remaining + sys.stdin.read(64*1024)
    if not chunk:
        break
    last_lf = chunk.rfind('\n')  # process to last LF character
    if last_lf == -1:
        remaining = ''
    else:
        remaining = chunk[last_lf+1:]
        chunk = chunk[:last_lf]
    counts.update(chunk.lower().split())

for word, count in counts.most_common():
    print(word, count)
As we did before, we are going to take a peek at the call stack.

Now there is more time spent in native code, caused by larger chunks of text passed to counter.update().
This becomes even more clear by comparing the stack charts.

Here, in the unoptimized case, we only read in one line at each loop iteration. This results in small "spikes" in the stack chart.
But let's take an even closer look.

Zoomed in, we see the call stack alternating between _count_elements() and (unfortunately unsymbolized) native calls coming from reading and splitting the input text (e.g., decode()).
Let us now take a look at the optimized case.
And if we look closer at the same interval as before, we see some spikes, but slightly different.

Even though we do not want to compare the (amount of) milliseconds directly, we clearly see that the spikes are wider, i.e. the time spent in those function calls is longer.
You may already know where this comes from.
We read a 64 Kb chunk of data from std in and pass that to counter.update(), so both these tasks do more work and take longer.
Bigger chunks mean there is less alternating between reading and counting, so there is more time spent doing work than "doing" loop iterations.
Getting started
You can get the converter from GitHub.
Both VMProf and the vmprof-firefox-converter were created for profiling PyPy, but you can also use them with CPython.
This project is still somewhat experimental, so if you want to try it out, please let us know whether it worked for you.
PyPy v7.3.16 release
PyPy v7.3.16: release of python 2.7, 3.9, and 3.10
The PyPy team is proud to release version 7.3.16 of PyPy.
This release includes security fixes from upstream CPython, and bugfixes to the garbage collector, described in a gc bug-hunt blog post.
The release includes three different interpreters:
PyPy2.7, which is an interpreter supporting the syntax and the features of Python 2.7 including the stdlib for CPython 2.7.18+ (the
+is for backported security updates)PyPy3.9, which is an interpreter supporting the syntax and the features of Python 3.9, including the stdlib for CPython 3.9.19.
PyPy3.10, which is an interpreter supporting the syntax and the features of Python 3.10, including the stdlib for CPython 3.10.14.
The interpreters are based on much the same codebase, thus the multiple release. This is a micro release, all APIs are compatible with the other 7.3 releases. It follows after 7.3.15 release on Jan 15, 2024
We recommend updating. You can find links to download the v7.3.16 releases here:
We would like to thank our donors for the continued support of the PyPy project. If PyPy is not quite good enough for your needs, we are available for direct consulting work. If PyPy is helping you out, we would love to hear about it and encourage submissions to our blog via a pull request to https://github.com/pypy/pypy.org
We would also like to thank our contributors and encourage new people to join the project. PyPy has many layers and we need help with all of them: bug fixes, PyPy and RPython documentation improvements, or general help with making RPython's JIT even better.
If you are a python library maintainer and use C-extensions, please consider making a HPy / CFFI / cppyy version of your library that would be performant on PyPy. In any case, both cibuildwheel and the multibuild system support building wheels for PyPy.
What is PyPy?
PyPy is a Python interpreter, a drop-in replacement for CPython It's fast (PyPy and CPython 3.7.4 performance comparison) due to its integrated tracing JIT compiler.
We also welcome developers of other dynamic languages to see what RPython can do for them.
We provide binary builds for:
x86 machines on most common operating systems (Linux 32/64 bits, Mac OS 64 bits, Windows 64 bits)
64-bit ARM machines running Linux (
aarch64).Apple M1 arm64 machines (
macos_arm64).s390x running Linux
PyPy support Windows 32-bit, Linux PPC64 big- and little-endian, and Linux ARM 32 bit, but does not release binaries. Please reach out to us if you wish to sponsor binary releases for those platforms. Downstream packagers provide binary builds for debian, Fedora, conda, OpenBSD, FreeBSD, Gentoo, and more.
What else is new?
For more information about the 7.3.16 release, see the full changelog.
Please update, and continue to help us make pypy better.
Cheers, The PyPy Team
Fixing a Bug in PyPy's Incremental GC
Introduction
Since last summer, I've been looking on and off into a weird and hard to reproduce crash bug in PyPy. It was manifesting only on CI, and it seemed to always happen in the AST rewriting phase of pytest, the symptoms being that PyPy would crash with a segfault. All my attempts to reproduce it locally failed, and my attempts to try to understand the problem by dumping the involved ASTs lead nowhere.
A few weeks ago, we got two more bug reports, the last one by the authors of the nanobind binding generator, with the same symptoms: crash in AST rewriting, only on CI. I decided to make a more serious push to try to find the bug this time. Ultimately the problem turned out to be several bugs in PyPy's garbage collector (GC) that had been there since its inception in 2013. Understanding the situation turned out to be quite involved, additionally complicated by this being the first time that I was working on this particular aspect of PyPy's GC. Since the bug was so much work to find, I thought I'd write a blog post about it.
The blog post consists of three parts: first a chronological description of what I did to find the bug, a technical explanation of what goes wrong, some reflections on the bug (and then a bonus bug I also found in the process).
Finding the Bug
I started from the failing nanobind CI runs that ended with a segfault of the PyPy interpreter. This was only an intermittent problem, not every run was failing. When I tried to just run the test suite locally, I couldn't get it to fail. Therefore at first I tried to learn more about what was happening by looking on the CI runners.
Running on CI
I forked the nanobind repo and hacked the CI script in order to get it to use a PyPy build with full debug information and more assertions turned on. In order to increase the probability of seeing the crash I added an otherwise unused matrix variable to the CI script that just contained 32 parameters. This means every build is done 32 times (sorry Github for wasting your CPUs 😕). With that amount of repetition, I got at least one job of every build that was crashing.
Then I added the -Xfaulthandler option to the PyPy command which will use the
faulthandler module
try to print a Python stacktrace if the VM segfaults to confirm that PyPy was
indeed crashing in the AST
rewriting
phase
of pytest, which pytest uses for nicer
assertions.
I experimented with hacking our faulthandler implementation to also give me a
C-level callstack, but that didn't work as well as I hoped.
Then I tried to run gdb on CI to try to get it
to print a C callstack at the crash point. You can get gdb to execute commands
as if typed at the prompt with the -ex commandline option, I used something
like this:
gdb -ex "set confirm off" -ex "set pagination off" -ex \
    "set debuginfod enabled off" -ex run -ex where -ex quit \
    --args <command> <arguments>
But unfortunately the crash never occurred when running in gdb.
Afterwards I tried the next best thing, which was configuring the CI runner to dump a core file and upload it as a build artifact, which worked. Looking at the cores locally only sort of worked, because I am running a different version of Ubuntu than the CI runners. So I used tmate to be able to log into the CI runner after a crash and interactively used gdb there. Unfortunately what I learned from that was that the bug was some kind of memory corruption, which is always incredibly unpleasant to debug. Basically the header word of a Python object had been corrupted somehow at the point of the crash, which means that it's vtable wasn't usable any more.
(Sidenote: PyPy doesn't really use a vtable pointer, instead it uses half a word in the header for the vtable, and the other half for flags that the GC needs to keep track of the state of the object. Corrupting all this is still bad.)
Reproducing Locally
At that point it was clear that I had to push to reproduce the problem on my laptop, to allow me to work on the problem more directly and not to always have to go via the CI runner. Memory corruption bugs often have a lot of randomness (depending on which part of memory gets modified, things might crash or more likely just happily keep running). Therefore I decided to try to brute-force reproducing the crash by simply running the tests many many times. Since the crash happened in the AST rewriting phase of pytest, and that happens only if no pyc files of the bytecode-compiled rewritten ASTs exist, I made sure to delete them before every test run.
To repeat the test runs I used multitime, which is a simple program that runs a command repeatedly. It's meant for lightweight benchmarking purposes, but it also halts the execution of the command if that command exits with an error (and it sleeps a small random time between runs, which might help with randomizing the situation, maybe). Here's a demo:
(Max pointed out autoclave to me when reviewing this post, which is a more dedicated tool for this job.)
Thankfully, running the tests repeatedly eventually lead to a crash, solving my
"only happens on CI" problem. I then tried various variants to exclude possible
sources of errors. The first source of errors to exclude in PyPy bugs is the
just-in-time compiler, so I reran the tests with --jit off to see whether I
could still get it to crash, and thankfully I eventually could (JIT bugs are
often very annoying).
Next source of bugs to exclude where C-extensions. Since those were the tests
of nanobind, a framework for creating C-extension modules I was a bit worried
that the bug might be in our emulation of CPython's C-API. But running PyPy
with the -v option (which will print all the imports as they happen)
confirmed that at the point of crash no C-extension had been imported yet.
Using rr
I still couldn't get the bug to happen in GDB, so the tool I tried next was
rr, the "reverse debugger". rr can record the execution of a program and
later replay it arbitrarily often. This gives you a time-traveling debugger
that allows you to execute the program backwards in addition to forwards.
Eventually I managed to get the crash to happen when running the tests with
rr record --chaos (--chaos randomizes some decisions that rr takes, to try to
increase the chance of reproducing bugs).
Using rr well is quite hard, and I'm not very good at it. The main approach I
use with rr to debug memory corruption is to replay the crash, then set a
watchpoint
for the corrupted memory location, then use the command reverse-continue to
find the place in the code that mutated the memory location. reverse-continue
is like continue, except that it will execute the program backwards from the
current point. Here's a little demo of this:
Doing this for my bug revealed that the object that was being corrupted was erroneously collected by the garbage collector. For some reason the GC had wrongly decided that the object was no longer reachable and therefore put the object into a freelist by writing a pointer to the next entry in the freelist into the first word of the object, overwriting the object's header. The next time the object was used things crashed.
Side-quest: wrong GC assertions
At this point in the process, I got massively side-tracked. PyPy's GC has a number of debug modes that you can optionally turn on. Those slow down the program execution a lot, but they should in theory help to understand why the GC goes wrong. When I turned them on, I was getting a failing assertion really early in the test execution, complaining about an invariant violation in the GC logic. At first this made me very happy. I thought that this would help me fix the bug more quickly.
Extremely frustratingly, after two days of work I concluded that the assertion logic itself was wrong. I have fixed that in the meantime too, the details of that are in the bonus section at the end of the post.
Using GDB scripting to find the real bug
After that disaster I went back to the earlier rr recording without GC assertions and tried to understand in more detail why the GC decided to free an object that was still being referenced. To be able to do that I used the GDB Python scripting API to write some helper commands to understand the state of the GC heap (rr is an extension of GDB, so the GDB scripting API works in rr too).
The first (small) helper command I wrote with the GDB scripting API was a way to pretty-print the currently active GC flags of a random PyPy object, starting just from the pointer. The more complex command I wrote was an object tracer, which follows pointers to GC objects starting from a root object to explore the object graph. The object tracer isn't complete, it doesn't deal with all the complexities of PyPy's GC. But it was good enough to help me with my problem, I found out that the corrupted object was stored in an array.
As an example, here's a function that uses the GDB API to walk one of the helper data structures of the GC, a stack of pointers:
def walk_addr_stack(obj):
    """ walk an instance of the AddressStack class (which is a linked list of
    arrays of 1019 pointers).

    the first of the arrays is only partially filled with used_in_last_chunk
    items, all the other chunks are full."""
    if obj.type.code == gdb.TYPE_CODE_PTR:
        obj = obj.dereference()
    used_in_last_chunk = lookup(obj, "used_in_last_chunk")
    chunk = lookup(obj, "inst_chunk").dereference()
    while 1:
        items = lookup(chunk, "items")
        for i in range(used_in_last_chunk):
            yield items[i]
        chunk = lookup(chunk, "next")
        if not chunk:
            break
        chunk = chunk.dereference()
        used_in_last_chunk = 1019
The full file of supporting code I wrote can be found in this gist. This is pretty rough throw-away code, however.
In the following recording I show a staged debugging session with some of the extra commands I wrote with the Python API. The details aren't important, I just wanted to give a bit of a flavor of what inspecting objects looks like:
The next step was to understand why the array content wasn't being correctly
traced by the GC, which I eventually managed with some conditional
breakpoints,
more watchpoints, and using reverse-continue. It turned out to be a bug that
occurs when the content of one array was memcopied into another array. The
technical details of why the array wasn't traced correctly are described in
detail in the next section.
Writing a unit test
To try to make sure I really understood the bug correctly I then wrote a GC unit test that shows the problem. Like most of PyPy, our GC is written in RPython, a (somewhat strange) subset/dialect of Python2, which can be compiled to C code. However, since it is also valid Python2 code, it can be unit-tested on top of a Python2 implementation (which is one of the reasons why we keep maintaining PyPy2).
In the GC unit tests you have a lot of control about what order things happen in, e.g. how objects are allocated, when garbage collection phases happen, etc. After some trying I managed to write a test that crashes with the same kind of memory corruption that my original crash exhibited: an object that is still reachable via an array is collected by the GC. To give you a flavor of what this kind of test looks like, here's an (edited for clarity) version of the test I eventually managed to write
def test_incrementality_bug_arraycopy(self):
    source = self.malloc(VAR, 8) # first array
    # the stackroots list emulates the C stack
    self.stackroots.append(source)
    target = self.malloc(VAR, 8) # second array
    self.stackroots.append(target)
    node = self.malloc(S) # unrelated object, will be collected
    node.x = 5
    # store reference into source array, calling the write barrier
    self.writearray(source, 0, node)
    val = self.gc.collect_step()
    source = self.stackroots[0] # reload arrays, they might have moved
    target = self.stackroots[1]
    # this GC step traces target
    val = self.gc.collect_step()

    # emulate what a memcopy of arrays does
    res = self.gc.writebarrier_before_copy(source, target, 0, 0, 2)
    assert res
    target[0] = source[0] # copy two elements of the arrays
    target[1] = source[1]
    # now overwrite the reference to node in source
    self.writearray(source, 0, lltype.nullptr(S))
    # this GC step traces source
    self.gc.collect_step()
    # some more collection steps, crucially target isn't traced again
    # but node is deleted
    for i in range(3):
        self.gc.collect_step()
    # used to crash, node got collected
    assert target[0].x == 5
One of the good properties of testing our GC that way is that all the memory is emulated. The crash in the last line of the test isn't a segfault at all, instead you get a nice exception saying that you tried to access a freed chunk of memory and you can then debug this with a python2 debugger.
Fixing the Bug
With the unit test in hand, fixing the test was relatively straightforward (the diff in its simplest form is anyway only a single line change). After this first version of my fix, I talked to Armin Rigo who helped me find different case that was still wrong, in the same area of the code.
I also got help by the developers at PortaOne who are using PyPy on their servers and had seen some mysterious PyPy crashes recently, that looked related to the GC. They did test deployments of my fixes in their various stages to their servers to try to see whether stability improved for them. Unfortunately in the end it turned out that their crashes are an unrelated GC bug related to object pinning, which we haven't resolved yet.
Writing a GC fuzzer/property based test
Finding bugs in the GC is always extremely disconcerting, particularly since this one managed to hide for so long (more than ten years!). Therefore I wanted to use these bugs as motivation to try to find more problems in PyPy's GC. Given the ridiculous effectiveness of fuzzing, I used hypothesis to write a property-based test. Every test performs a sequence of randomly chosen steps from the following list:
- allocate an object
- read a random field from a random object
- write a random reference into a random object
- drop a random stack reference
- perform one GC step
- allocate an array
- read a random index from a random array
- write to an array
- memcopy between two arrays
This approach of doing a sequence of steps is pretty close to the stateful testing approach of hypothesis, but I just implemented it manually with the data strategy.
Every one of those steps is always performed on both the tested GC, and on some regular Python objects. The Python objects provide the "ground truth" of what the heap should look like, so we can compare the state of the GC objects with the state of the Python objects to find out whether the GC made a mistake.
In order to check whether the test is actually useful, I reverted my bug fixes and made sure that the test re-finds both the spurious GC assertion error and the problems with memcopying an array.
In addition, the test also found corner cases in my fix. There was a situation that I hadn't accounted for, which the test found after eventually. I also plan on adding a bunch of other GC features as steps in the test to stress them too (for example weakrefs, identity hashes, pinning, maybe finalization).
At the point of publishing this post, the fixes got merged to the 2.7/3.9/3.10 branches of PyPy, and will be part of the next release (v7.3.16).
The technical details of the bug
In order to understand the technical details of the bug, I need to give some background explanations about PyPy's GC.
PyPy's incremental GC
PyPy uses an incremental generational mark-sweep GC. It's generational and therefore has minor collections (where only young objects get collected) and major collections (collecting long-lived objects eventually, using a mark-and-sweep algorithm). Young objects are allocated in a nursery using a bump-pointer allocator, which makes allocation quite efficient. They are moved out of the nursery by minor collections. In order to find references from old to young objects the GC uses a write barrier to detect writes into old objects.
The GC is also incremental, which means that its major collections aren't done all at once (which would lead to long pauses). Instead, major collections are sliced up into small steps, which are done directly after a minor collection (the GC isn't concurrent though, which would mean that the GC does work in a separate thread).
The incremental GC uses tri-color marking to reason about the reachable part of the heap during the marking phase, where every old object can be:
- black: already marked, reachable, definitely survives the collection
- grey: will survive, but still needs to be marked
- white: potentially dead
The color of every object is encoded by setting flags in the object header.
The GC maintains the invariant that black objects must never point to white objects. At the start of a major collection cycle the stack roots are turned gray. During the mark phase of a major collection cycle, the GC will trace gray objects, until none are left. To trace a gray object, all the objects it references have to be marked grey if they are white so far. After a grey object is traced, it can be marked black (because all the referenced objects are now either black or gray). Eventually, there are no gray objects left. At that point (because no white object can be reached from a black one) all the white objects are known to be unreachable and can therefore be freed.
The GC is incremental because every collection step will only trace a limited number of gray objects, before giving control back to the program. This leads to a problem: if an already traced (black) object is changed between two marking steps of the GC, the program can mutate that object and write a new reference into one of its fields. This could lead to an invariant violation, if the referenced object is white. Therefore, the GC uses the write barrier (which it needs anyway to find references from old to young objects) to mark all black objects that are modified gray, and then trace them again at one of the later collection steps.
The special write barrier of memcopy
Arrays use a different kind of write barrier than normal objects. Since they can be arbitrarily large, tracing them can take a long time. Therefore it's potentially wasteful to trace them fully at a minor collection. To fix this, the array write barrier keeps more granular information about which parts of the array have been modified since the last collection step. Then only the modified parts of the array need to be traced, not the whole array.
In addition, there is another optimization for arrays, which is that memcopy is treated specially by the GC. If memcopy is implemented by simply writing a loop that copies the content of one array to the other, that will invoke the write barrier every single loop iteration for the write of every array element, costing a lot of overhead. Here's some pseudo-code:
def arraycopy(source, dest, source_start, dest_start, length):
    for i in range(length):
        value = source[source_start + i]
        dest[dest_start + i] = value # <- write barrier inserted here
Therefore the GC has a special memcopy-specific
write barrier that will perform the GC logic once before the memcopy loop, and
then use a regular (typically SIMD-optimized) memcopy implementation from
libc. Roughly like this:
def arraycopy(source, dest, source_start, dest_start, length):
    gc_writebarrier_before_array_copy(source, dest, source_start, dest_start, length)
    raw_memcopy(cast_to_voidp(source) + source_start,
                cast_to_voidp(dest) + dest_start,
                sizeof(itemtype(source)) * length)
(this is really a rough sketch. The real code is much more complicated.)
The bug
The bugs turned out to be precisely in this memcopy write barrier. When we implemented the current GC, we adapted our previous GC, which was a generational mark-sweep GC but not incremental. We started with most of the previous GC's code, including the write barriers. The regular write barriers were adapted to the new incremental assumptions, in particular the need for the write barrier to also turn black objects back to gray when they are modified during a marking phase. This was simply not done at all for the memcopy write barrier, at least in two of the code paths. Fixing this problem fixes the unit tests and stops the crashes.
Reflections
The way the bug was introduced is really typical. A piece of code (the memcopy write barrier) was written under a set of assumptions. Then those assumptions changed later. Not all the code pieces that relied on these assumptions to be correct were updated. It's pretty hard to prevent this in all situations.
I still think we could have done more to prevent the bug occurring. Writing a
property-based test for the GC would have been a good idea given the complexity
of the GC, and definitely something we did in other parts of our code at the
time (just using the random module mostly, we started using hypothesis
later).
It's a bit of a mystery to me why this bug managed to be undetected for so
long. Memcopy happens in a lot of pretty core operations of e.g. lists in
Python (list.extend, to name just one example). To speculate, I would suspect
that all the other preconditions for the bug occurring made it pretty rare:
- the content of an old list that is not yet marked needs to be copied into another old list that is marked already
- the source of the copy needs to also store an object that has no other references
- the source of the copy then needs to be overwritten with other data
- then the next collection steps need to be happening at the right points
- ...
Given the complexity of the GC logic I also wonder whether some lightweight formal methods would have been a good idea. Formalizing some of the core invariants in B or TLA+ and then model checking them up to some number of objects would have found this problem pretty quickly. There are also correctness proofs for GC algorithms in some research papers, but I don't have a good overview of the literature to point to any that are particularly good or bad. Going such a more formal route might have fixed this and probably a whole bunch of other bugs, but of course it's a pretty expensive (and tedious) approach.
While it was super annoying to track this down, it was definitely good to learn a bit more about how to use rr and the GDB scripting interface.
Bonus Section: The Wrong Assertion
Some more technical information about the wrong assertion is in this section.
Background: pre-built objects
PyPy's VM-building bootstrapping process can "freeze" a bunch of heap objects into the final binary. This allows the VM to start up quickly, because those frozen objects are loaded by the OS as part of the binary.
Those frozen pre-built objects are parts of the 'roots' of the garbage collector and need to be traced. However, tracing all the pre-built objects at every collection would be very expensive, because there are a lot of them (about 150,000 in a PyPy 3.10 binary). Tracing them all is also not necessary, because most of them are never modified. Unmodified pre-built objects can only reference other pre-built objects, which can never be deallocated anyway. Therefore we have an optimization that uses the write barrier (which we need anyway to find old-to-young pointers) to notice when a pre-built object gets modified for the very first time. If that happens, it gets added to the set of pre-built objects that gets counted as a root, and is traced as a root at collections from then on.
The wrong assertion
The assertion that triggered when I turned on the GC debug mode was saying that the GC found a reference from a black to a white object, violating its invariant. Unmodified pre-built objects count as black, and they aren't roots, because they can only ever reference other pre-built objects. However, when a pre-built object gets modified for the first time, it becomes part of the root set and will be marked gray. This logic works fine.
The wrong assertion triggers if a pre-built object is mutated for the very first time in the middle of an incremental marking phase. While the pre-built object gets added to the root set just fine, and will get traced before the marking phase ends, this is encoded slightly differently for pre-built objects, compared to "regular" old objects. Therefore, the invariant checking code wrongly reported a black->white pointer in this situation.
To fix it I also wrote a unit test checking the problem, made sure that the GC hypothesis test also found the bug, and then fixed the wrong assertion to take the color encoding of pre-built objects into account.
The bug managed to be invisible because we don't tend to turn on the GC assertions very often. We only do that when we find a GC bug, which is of course also when we need it the most to be correct.
Acknowledgements
Thanks to Matti Picus, Max Bernstein, Wouter van Heyst for giving me feedback on drafts of the post. Thanks to Armin Rigo for reviewing the code and pointing out holes in my thinking. Thanks to the original reporters of the various forms of the bug, including Lily Foote, David Hewitt, Wenzel Jakob.
PyPy v7.3.15 release
PyPy v7.3.15: release of python 2.7, 3.9, and 3.10
The PyPy team is proud to release version 7.3.15 of PyPy.
This is primarily a bug-fix release, and includes work done to migrate PyPy to Git and Github.
The release includes three different interpreters:
PyPy2.7, which is an interpreter supporting the syntax and the features of Python 2.7 including the stdlib for CPython 2.7.18+ (the
+is for backported security updates)PyPy3.9, which is an interpreter supporting the syntax and the features of Python 3.9, including the stdlib for CPython 3.9.18.
PyPy3.10, which is an interpreter supporting the syntax and the features of Python 3.10, including the stdlib for CPython 3.10.13.
The interpreters are based on much the same codebase, thus the multiple release. This is a micro release, all APIs are compatible with the other 7.3 releases. It follows after 7.3.14 release on Dec 25, 2023
We recommend updating. You can find links to download the v7.3.15 releases here:
We would like to thank our donors for the continued support of the PyPy project. If PyPy is not quite good enough for your needs, we are available for direct consulting work. If PyPy is helping you out, we would love to hear about it and encourage submissions to our blog via a pull request to https://github.com/pypy/pypy.org
We would also like to thank our contributors and encourage new people to join the project. PyPy has many layers and we need help with all of them: bug fixes, PyPy and RPython documentation improvements, or general help with making RPython's JIT even better.
If you are a python library maintainer and use C-extensions, please consider making a HPy / CFFI / cppyy version of your library that would be performant on PyPy. In any case, both cibuildwheel and the multibuild system support building wheels for PyPy.
What is PyPy?
PyPy is a Python interpreter, a drop-in replacement for CPython It's fast (PyPy and CPython 3.7.4 performance comparison) due to its integrated tracing JIT compiler.
We also welcome developers of other dynamic languages to see what RPython can do for them.
We provide binary builds for:
x86 machines on most common operating systems (Linux 32/64 bits, Mac OS 64 bits, Windows 64 bits)
64-bit ARM machines running Linux (
aarch64).Apple M1 arm64 machines (
macos_arm64).s390x running Linux
PyPy support Windows 32-bit, Linux PPC64 big- and little-endian, and Linux ARM 32 bit, but does not release binaries. Please reach out to us if you wish to sponsor binary releases for those platforms. Downstream packagers provide binary builds for debian, Fedora, conda, OpenBSD, FreeBSD, Gentoo, and more.
What else is new?
For more information about the 7.3.15 release, see the full changelog.
Please update, and continue to help us make pypy better.
Cheers, The PyPy Team
PyPy has moved to Git, GitHub
PyPy has moved its canonical repo and issue tracker from https://foss.heptapod.net/pypy/pypy to https://github.com/pypy/pypy. Obviously, this means development will now be tracked in Git rather than Mercurial.
Motivation
We still feel Mercurial is a better version control system. The named branch model and user interface are superior. But
-
foss.heptapod.net is not well indexed in google/bing/duckduckgo search, so people find it harder to search for issues in the project.
-
Since Heptapod has tightened its spam control, we get reports that users create issues only to have them flagged as spam.
-
Open Source has become synonymous with GitHub, and we are too small to change that.
-
Much of the current development comes as a reaction to fixing issues. Tracking interlocking issues is easier if all the code is on the same platform.
-
The FAQ presents two arguments against the move. Github notes solves much of point (1): the difficulty of discovering provenance of commits, although not entirely. But the main problem is point (2), it turns out that not moving to GitHub is an impediment to contribution and issue reporting.
-
People who wish to continue to use Mercurial can use the same method below to push to GitHub.
-
GitHub is more resource rich than foss.heptapod.net. We could add CI jobs to replace some of our aging buildbot infrastructure.
Method
The migration required two parts: migrating the code and then migrating the issues and merge requests.
Code migration 1: code and notes
I used a fork of git-remote-hg to
create a local Git repo with all the changesets. Then I wanted to add a Git
note to each commit with the branch it came from. So I prepared a file with two
columns: the Git commit hash, and the corresponding branch from Mercurial.
Mercurial can describe each commit in two ways: either the commit hash or by a
number index. I used hg log to convert an index i to the Mercurial hash,
and then git-hg-helper from git-remote-hg to convert the Mercurial hash to
a Git hash:
$(cd pypy-git; git-hg-helper git-rev $(cd ../pypy-hg; hg log -r $i -T"{node}\n"))
Then I used hg log again to print the Mercurial branch for the index i:
$(cd pypy-hg; hg log -r $i -T'{branch}\n')
Putting these two together, I could loop over all the commits by their
numerical index to prepare the file. Then I iterated over each line in the
file, and added the Git note. Since the git note add command works on the
current HEAD, I needed to checkout each commit in turn and then add the note:
git checkout -q <hash> && git notes --ref refs/notes/branch add -m branch:<branch>
I could then use git push --all to push to GitHub.
Code migration 2: prepare the branches
PyPy has almost 500 open branches. The code migration created all the branch
HEADs, but git push --all did not push them. I needed to check them out and
push each one. So I created a file with all the branch names
cd pypy-hg; hg branches | cut -f1 -d" " > branches.txt
and then push each one to the GitHub repo
while read branch; do git checkout branches/$branch && git push origin branches/$branch; done < branches.txt
Note that the branches were named branches/XXX by the migration, not branch/XXX. This confuses the merge request migration, more about that later.
Issue and merge request migration
I used the solution from node-gitlab-2-github which worked almost perfectly. It is important to do the conversion on a private repo otherwise every mention of a successfully mapped user name notifies the user about the transfer. This can be quite annoying for a repo the size of PyPy with 600 merge requests and over 4000 issues. Issues transferred without a problem: the script properly retained the issue numbers. However the script does not convert the Mercurial hashes to Git hashes, so the bare hashes in comments show up without a link to the commit. Merge requests are more of a problem:
- The Mercurial named branch "disappears" once it is merged, so a merge request
to a merged branch does not find the target branch name in Git. The
conversion creates an issue instead with the label
gitlab merge request. - For some reason, the branches created by
git-remote-hgare calledbranches/XXXand notbranch/XXXas expected by GitLab. This messes up the merge request/PR conversion. For some of the branches (open PRs and main target branches) I manually created additional branches without thees. The net result is that open merge requests became open PRs, merged merge requests became issues, and closed-not-merged merge requests were not migrated.
Layered conversions
PyPy already migrated once from Bitbucket to Heptapod. Many of the issues reflect the multiple transitions: they have lines like "Created originally on Bitbucket by XXX" from the first transition, and an additional line "In Heptapod" from this transition.
Credits
We would like to express our gratitude to the Octobus team who support Heptapod. The transition from Bitbucket was quite an effort, and they have generously hosted our development since then. We wish them all the best, and still believe that Mercurial should have "won".
Next steps
While the repo at GitHub is live, there are still a few more things we need to do:
- Documentation needs an update for the new repo and the build automation from readthedocs must be adjusted.
- The wiki should be copied from Heptapod.
- buildbot.pypy.org should also look at the new repo. I hope the code is up to the task of interacting with a Git repo.
- speed.pypy.org tracks changes, it too needs to reference the new location
- To keep tracking branches with Git notes on new commits, I activated a github action by Julian to add a Git branch note to each commit. Please see the README there for directions on using Git notes.
- Some of the merge requests were not migrated. If someone wants to, they could migrate those once they figure out the branch naming problems.
Additionally, now is the time for all of you to prove the move is worthwhile:
- Star the repo, let others know how to find it,
- Help fix some of the open issues or file new ones,
- Take advantage of the more familiar workflow to get involved in the project,
- Suggest ways to improve the migration: are there things I missed or could have done better?
How will development change?
Heptapod did not allow personal forks, so we were generous with a commit bit to the main repo. Additionally, we (well, me) have been using a commit-directly-to-main workflow. We will now be adopting a more structured workflow. Please fork the repo and submit a pull request for any changes. We can now add some pre-merge CI to check that the PR at least passes the first stage of translation. The live and active branches will be:
-
main: what was "default" in Mercurial, it is the Python2.7 interpreter and the base of the RPython interpreter, -
py3.9: the Python3.9 interpreter, which also includes all RPython changes frommain. This is exactly like on Mercurial, and -
py3.10: the Python3.10 interpreter, which also includes all RPython changes frommainand all bugfixes frompy3.9. This is exactly like on Mercurial.
Working between the repos
Finding commits
If you want to figure out how a Mercurial commit relates to a Git commit, you
can use git-hg-helper. You run it in the Git repo. It takes the full long
hash from one repo and gives you the corresponding hash of the other repo:
$ git-hg-helper git-rev d64027c4c2b903403ceeef2c301f5132454491df
4527e62ad94b0e940a5b0f9f20d29428672f93f7
$ git-hg-helper hg-rev 4527e62ad94b0e940a5b0f9f20d29428672f93f7
d64027c4c2b903403ceeef2c301f5132454491df
Finding branches
Branches migrated from Mercurial will have a branches prefix, not branch.
While GitLab uses branch for its prefix, the git-remote-hg script uses
branches. New work should be in a PR targeting main, py3.9 or py3.10.
Thanks for helping to make PyPy better.
Matti
Update
In the meantime we found out that unfortunately something went wrong in the migration of the issues. The old issue 3655 got lost in the migration. This means that after number 3655 the numbers are different between github and heptapod, with heptapod being one larger. E.g. issue 3700 on heptapod is issue 3699 on github. We are investigating options.
PyPy v7.3.14 release
PyPy v7.3.14: release of python 2.7, 3.9, and 3.10
The PyPy team is proud to release version 7.3.14 of PyPy.
Highlights of this release are compatibility with HPy-0.9, cffi 1.16, additional C-API interfaces, and more python3.10 fixes.
The release includes three different interpreters:
PyPy2.7, which is an interpreter supporting the syntax and the features of Python 2.7 including the stdlib for CPython 2.7.18+ (the
+is for backported security updates)PyPy3.9, which is an interpreter supporting the syntax and the features of Python 3.9, including the stdlib for CPython 3.9.18.
PyPy3.10, which is an interpreter supporting the syntax and the features of Python 3.10, including the stdlib for CPython 3.10.13.
The interpreters are based on much the same codebase, thus the multiple release. This is a micro release, all APIs are compatible with the other 7.3 releases. It follows after 7.3.13 release on Sept 29, 2023.
We recommend updating. You can find links to download the v7.3.14 releases here:
We would like to thank our donors for the continued support of the PyPy project. If PyPy is not quite good enough for your needs, we are available for direct consulting work. If PyPy is helping you out, we would love to hear about it and encourage submissions to our blog via a pull request to https://github.com/pypy/pypy.org
We would also like to thank our contributors and encourage new people to join the project. Since the last release we have contributions from three new contributors. PyPy has many layers and we need help with all of them: bug fixes, PyPy and RPython documentation improvements, or general help with making RPython's JIT even better.
If you are a python library maintainer and use C-extensions, please consider making a HPy / CFFI / cppyy version of your library that would be performant on PyPy. In any case, both cibuildwheel and the multibuild system support building wheels for PyPy.
What is PyPy?
PyPy is a Python interpreter, a drop-in replacement for CPython It's fast (PyPy and CPython 3.7.4 performance comparison) due to its integrated tracing JIT compiler.
We also welcome developers of other dynamic languages to see what RPython can do for them.
We provide binary builds for:
x86 machines on most common operating systems (Linux 32/64 bits, Mac OS 64 bits, Windows 64 bits)
64-bit ARM machines running Linux (
aarch64).Apple M1 arm64 machines (
macos_arm64).s390x running Linux
PyPy support Windows 32-bit, Linux PPC64 big- and little-endian, and Linux ARM 32 bit, but does not release binaries. Please reach out to us if you wish to sponsor binary releases for those platforms. Downstream packagers provide binary builds for debian, Fedora, conda, OpenBSD, FreeBSD, Gentoo, and more.
What else is new?
For more information about the 7.3.14 release, see the full changelog.
Please update, and continue to help us make pypy better.
Cheers, The PyPy Team
PyPy v7.3.13 release
PyPy v7.3.13: release of python 2.7, 3.9, and 3.10
The PyPy team is proud to release version 7.3.13 of PyPy.
This is primarily a security/bug-fix release. CPython released security
patches, and this release also improves the ability to use type
specifications via PyType_FromSpec and friends. There are also some
small speed-ups.
The release includes three different interpreters:
PyPy2.7, which is an interpreter supporting the syntax and the features of Python 2.7 including the stdlib for CPython 2.7.18+ (the
+is for backported security updates)PyPy3.9, which is an interpreter supporting the syntax and the features of Python 3.9, including the stdlib for CPython 3.9.18.
PyPy3.10, which is an interpreter supporting the syntax and the features of Python 3.10, including the stdlib for CPython 3.10.13. Note it requires at least cython 0.29.35 or cython 3.0.0b3.
The interpreters are based on much the same codebase, thus the multiple release. This is a micro release, all APIs are compatible with the other 7.3 releases. It follows after 7.3.12 release on June 16, 2023.
We recommend updating. You can find links to download the v7.3.13 releases here:
We would like to thank our donors for the continued support of the PyPy project. If PyPy is not quite good enough for your needs, we are available for direct consulting work. If PyPy is helping you out, we would love to hear about it and encourage submissions to our blog via a pull request to https://github.com/pypy/pypy.org
We would also like to thank our contributors and encourage new people to join the project. PyPy has many layers and we need help with all of them: bug fixes, PyPy and RPython documentation improvements, or general help with making RPython's JIT even better.
If you are a python library maintainer and use C-extensions, please consider making a HPy / CFFI / cppyy version of your library that would be performant on PyPy. In any case, both cibuildwheel and the multibuild system support building wheels for PyPy.
What is PyPy?
PyPy is a Python interpreter, a drop-in replacement for CPython It's fast (PyPy and CPython 3.7.4 performance comparison) due to its integrated tracing JIT compiler.
We also welcome developers of other dynamic languages to see what RPython can do for them.
We provide binary builds for:
x86 machines on most common operating systems (Linux 32/64 bits, Mac OS 64 bits, Windows 64 bits)
64-bit ARM machines running Linux (
aarch64).Apple M1 arm64 machines (
macos_arm64).s390x running Linux
PyPy support Windows 32-bit, Linux PPC64 big- and little-endian, and Linux ARM 32 bit, but does not release binaries. Please reach out to us if you wish to sponsor binary releases for those platforms. Downstream packagers provide binary builds for debian, Fedora, conda, OpenBSD, FreeBSD, Gentoo, and more.
What else is new?
For more information about the 7.3.13 release, see the full changelog.
Please update, and continue to help us make pypy better.
Cheers, The PyPy Team